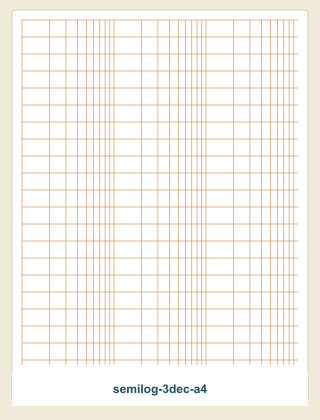
3-Decade Semi-Log — A4
Standard 3-cycle semi-log paper. Y-axis logarithmic, X-axis linear with 5mm grid. Essential for Bode plots and exponential data.
Log graph paper compresses each power of ten into one repeating block, so data spanning huge ranges fits on a single sheet —and exponential curves straighten into lines you can measure. This free printable log graph paper generator does both classic formats: semi-log (log Y, linear X) and log-log (both axes logarithmic), with 1 to 5 cycles, four grid colors including the classic orange-brown, and a print-accurate PDF download. A4 or Letter, no signup, no watermark.
✓ Real-time preview — every change updates instantly.
For accurate cycle heights, choose “Actual Size” (not “Fit to Page”) in your printer dialog.
One-click download of ready-made log graph paper — or open any template in the generator above to tweak it.
Standard 3-cycle semi-log paper. Y-axis logarithmic, X-axis linear with 5mm grid. Essential for Bode plots and exponential data.
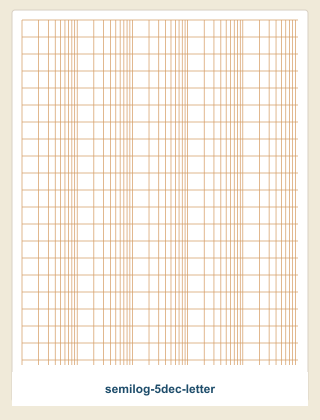
5-cycle semi-log paper spanning a wide dynamic range. Used for frequency response, pH titration curves, and population growth.
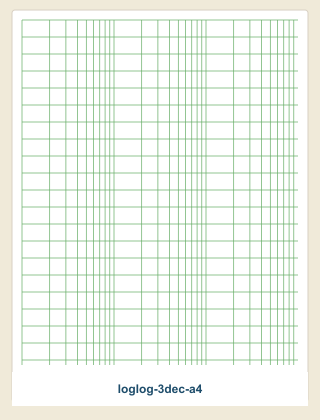
Full log-log paper with 3 decades on each axis. For power-law relationships, earthquake magnitudes, and signal processing.
Choose 2, 3, 4, or 5 cycles for a semi-log sheet, or switch to log-log when both axes need logarithmic spacing. The generator supports one through five cycles, so you can match the vertical range to your data.
3-cycle semi-log graph paper PDF, 5-cycle semi-log graph paper PDF, and 3-cycle log-log graph paper PDF are ready-made examples. Change the cycle count or scale mode above to make another variation.
Log graph paper —logarithmic graph paper —spaces its lines by the logarithm of the value instead of the value itself. Within each repeating block, called a cycle or decade, the lines for 2 through 9 crowd closer together as they rise, and every full block represents a factor of ten. The payoff is twofold: data spanning several orders of magnitude fits on one readable sheet, and the two classic curve families straighten out —exponentials become straight lines on semi-log graph paper, and power laws become straight lines on log-log graph paper. A straight line is something you can fit by eye and measure with a ruler, which is exactly why lab courses still hand out this paper.
The cycles on this log graph paper are intentionally unnumbered. Start by writing values on the heavy cycle boundaries to match your data —1, 10, 100, 1,000 going up, or 0.01, 0.1, 1 for small quantities. Within a cycle, the unlabeled lines are that decade's 2, 3, 4 —9 (the slightly heavier mid-line is 5). Then plot each point by finding its decade first and its digit line second: 350 sits on the 3.5 position of the 100-to-1,000 cycle.
If your exponential data does not form a straight line on semi-log graph paper, that is information too: a curve that sags is growing slower than exponential, and one that steepens is growing faster. The paper is a diagnosis tool, not just a display.
One cycle covers a 10× range, so count the powers of ten your data spans: measurements from 5 to 800 need three decades (1–10–100–1,000), which is why 3 cycle log graph paper is the classic lab default. Two cycles suit narrow ranges with fine reading precision; four and five cycles handle wide-range data like frequency sweeps from 10 Hz to 1 MHz. Fewer cycles = taller decades = easier interpolation.
The default orange-brown matches the classic printed semi-log pads, with engineering green, gray, and blue alternatives. On semi-log mode the linear axis offers 5 mm, 10 mm, or 0.1 inch spacing. Every sheet of log graph paper exports as a vector PDF in six paper sizes —log graph paper A4 or Letter for coursework, up to A3 for wide frequency sweeps — with up to 100 identical pages per file.
Electronics students sketch filter and amplifier responses on semi-log graph paper —log frequency across, linear dB up. A 4–5 cycle sheet covers audio to RF in one plot.
Bacterial growth curves, radioactive half-lives, and compound interest all straighten on a log axis. The slope reads out the growth or decay rate directly — no curve fitting needed.
Earthquake magnitude-frequency, allometric scaling, and pump curves plot straight on log-log graph paper, and the line's slope is the exponent —measure it with a ruler.
pH work, serial dilutions, and drug elimination curves span orders of magnitude by nature. Lab handouts still specify "plot on 3 cycle semi-log paper" —print exactly that here.
Both modes live in the generator above; the choice follows your math. If only one variable explodes across orders of magnitude, keep the other axis linear —that is semi-log. If both do, go log-log. For ordinary linear data, plain graph paper or a numbered coordinate plane serves better.
| Semi-log graph paper | Log-log graph paper | |
|---|---|---|
| Axes | Y logarithmic, X linear | Both axes logarithmic |
| Straightens | Exponentials: y = a·bˣ | Power laws: y = a·xⁿ |
| Slope means | Growth / decay rate | The exponent n itself |
| Classic uses | Bode plots, growth curves, half-lives | Scaling laws, spectra, pump curves |
Semi-log graph paper has one logarithmic axis and one linear axis. On this sheet the vertical axis is logarithmic —each repeating block (cycle) covers one power of ten —while the horizontal axis is an ordinary evenly spaced grid. Its superpower: exponential data, which curves steeply on ordinary graph paper, plots as a straight line on semi-log paper, so you can read growth rates and time constants directly from the slope.
A cycle — also called a decade — is one repeat of the logarithmic pattern, covering a factor of ten (1 to 10, 10 to 100, and so on). Three-cycle paper stacks three of those blocks, spanning a 1000× range such as 1 to 1,000 or 0.01 to 10. Pick the number of cycles to match your data’s range: this generator goes from 1 to 5 cycles.
Use semi-log paper when only one variable spans orders of magnitude or the relationship is exponential (y = a·bˣ) — growth curves, radioactive decay, Bode frequency plots. Use log-log paper when both variables span orders of magnitude or the relationship is a power law (y = a·xⁿ — the exponent n appears directly as the slope of the straight line.
Because log(0) is undefined —each step down a logarithmic axis divides by ten, so the axis approaches zero forever without reaching it. The bottom line of the sheet is whatever positive value you assign it (1, 0.1, 0.001—, never zero, and negative values cannot be plotted on a log axis at all.
The decades are intentionally unnumbered, so one sheet serves any range: write your own values on the heavy cycle boundaries —for example 1, 10, 100, 1,000 going up, or 0.01, 0.1, 1 for small quantities. The heavier mid-line inside each cycle marks 5× that decade’s start, which makes reading intermediate values faster.
Yes. The generator exports a vector PDF in six paper sizes — Letter, A4, A5, Legal, Tabloid, and A3 — in portrait or landscape, with up to 100 identical pages per file. Choose “Actual Size” (100%) when printing so the grid keeps its exact dimensions.